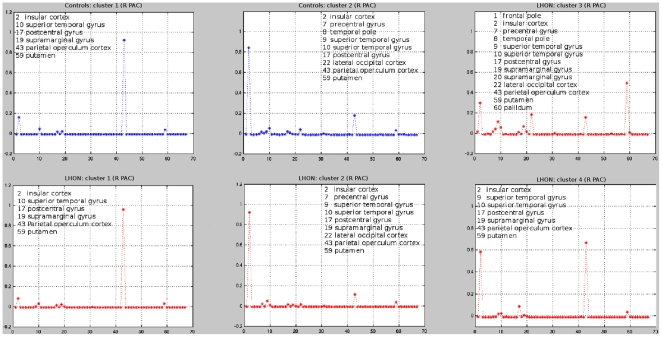
Figure 3. Clusters and cluster-centroids identified in the right (R) primary auditory cortex (PAC) in healthy controls (blue) and Leber's hereditary optic neuropathy (LHON) patients (red).
The silhouette analysis identified two clusters in healthy controls and four clusters in LHON patients. The cluster-centroid profile analysis of the R PAC of LHON patients showed a structural connectivity with the frontal pole, the pallidum, and the supramarginal gyrus, which was not detected in controls. X-axis reports brain areas classified according to the Harvard-Oxford cortical and subcortical atlas.

