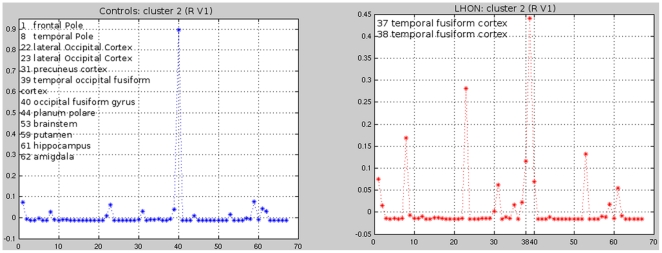
Figure 4. Cluster-centroid profile analysis of the right V1 (cluster II) in healthy controls (blue) and patients with Leber's Hereditary Optic Neuropathy (LHON) (red).
The right V1 of LHON patients had a structural connectivity with the temporal fusiform cortex, which was not detected in controls. In addition, compared to controls, the right V1 of LHON patients had an increased structural connectivity with the temporal occipital fusiform cortex and a decreased structural connectivity with the lateral occipital cortex and the occipital fusiform gyrus. X-axis reports areas classified according to the Harvard-Oxford cortical and subcortical atlas.

