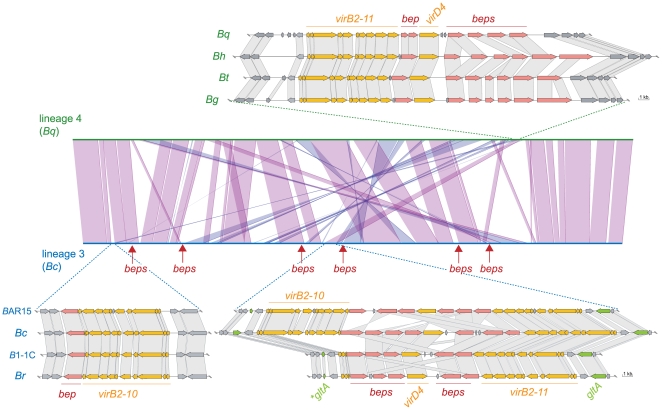
Figure 3. Genomic organization of the virB T4SS and bep gene loci in the two radiating lineages.
Synteny plot of Bc (lineage 3) and Bq (lineage 4) generated in MaGe [58] and genetic organization of the virB T4SS loci. Syntenic relationships comprising at least five genes are indicated by violet and blue lines for genes found on the same or the opposite strand, respectively. The genomic integration sites of virB loci are indicated. Additional bep loci in lineage 3 are marked by arrows. For the depicted genomic loci, orthologous genes are connected via gray boxes. For bep genes, connections are drawn if they belong to the same Bep clade (Figure 4) or if they are top blast hits of one another. The glutamine syntethase I gene (glnA) and its fragments which are flanking the two inverted virB T4SS copies are colored in green. The fragments are indicated by an asterisk.

