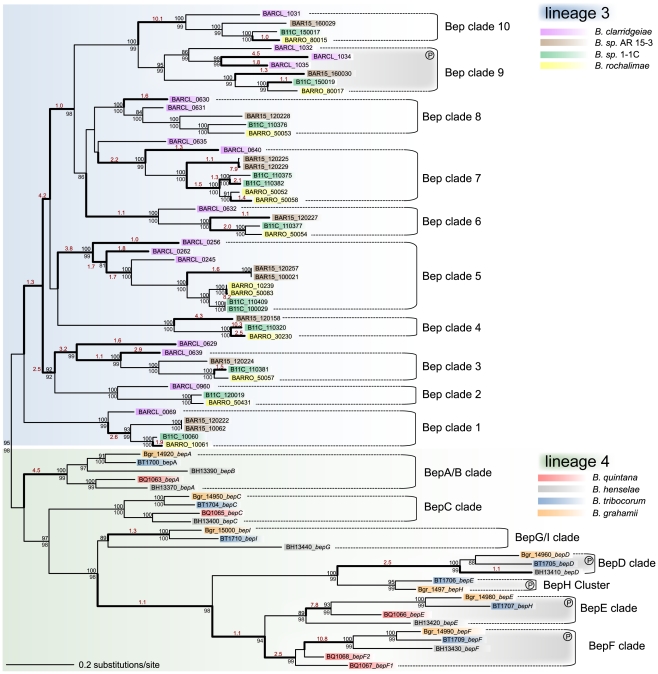
Figure 4. Gene tree of Bartonella effector proteins.
The maximum likelihood tree is based on the BID domain and the C-terminal extension of all bep genes. Numbers above the branches represent maximum likelihood bootstraps (100 replicates); numbers below Bayesian posterior probabilities. Values ≥80% are shown. The independent clustering of the bep genes from lineage 3 and lineage 4 is indicated by blue and green shading, respectively. Different bep genes are named with locus_tag and gene name (if existing) and they are color-coded species-specifically according to the legend. Bold type highlights phylogenetic branches with dn/ds values >1 (the estimated dn/ds value is indicated in red color type). Sub-clades comprising orthologous bep genes are indicated (Bep clades). In lineage 3, BARCL_0629 and BARCL_0635 are not included in any clade since their phylogenetic position is neither supported by bootstraps nor posterior probabilities. In both lineages, clades of bep genes encoding tandem-repeated tyrosine-phosphorylation motifs are indicated by gray shading and an encircled ‘P’ symbol.

