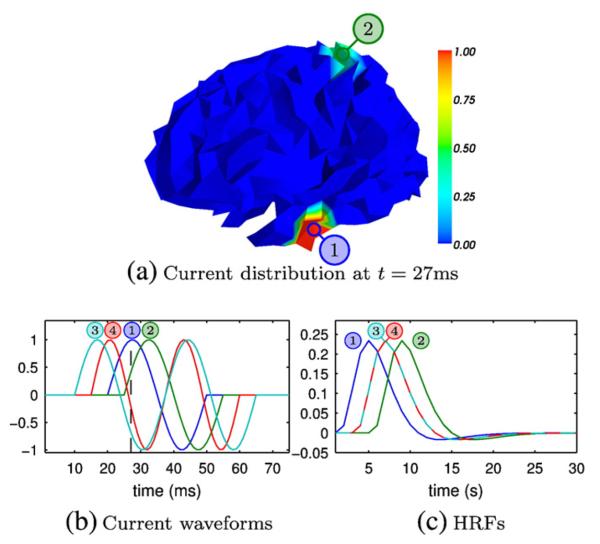
Fig. 4.
Source configurations used for simulations. The upper panel illustrates an example current distribution of a simulation with the MM scenario (two multimodal sources); the lower panels show the current waveforms and HRFs used for the simulations. The numbers refer to the source numbers in Table 2.

