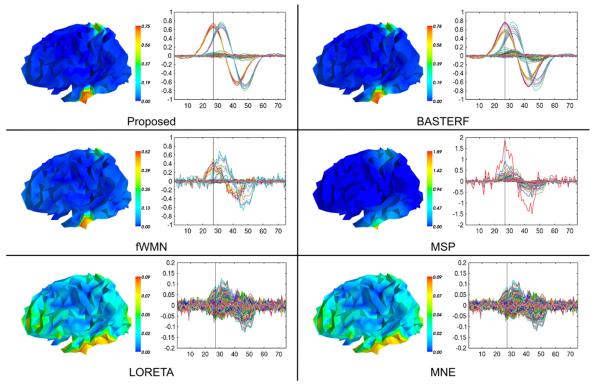
Fig. 5.
Butterfly plots of the estimated currents (Ŝ) and their projection onto the cortical mesh at t=27 ms for one simulation of the scenario MM (SNR EEG=20 dB). The ground truth for this simulation is depicted in Fig. 4. Note that the color scales are adjusted for each method to show the full range of the source distribution and that the y-axis of the butterfly plots for the MSP, LORETA, and MNE methods has been adjusted to allow for a clear depiction of the estimated current waveforms.

