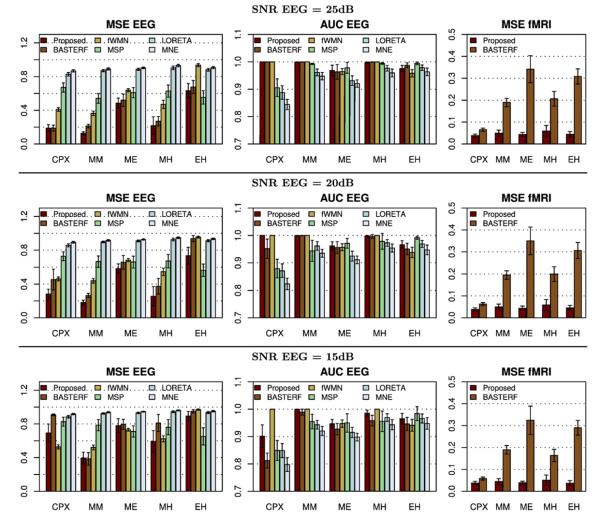
Fig. 7.
Objective quality metric scores for different simulation scenarios. The mean squared error scores for the estimated currents and hemodynamic response functions are denoted as MSE EEG and MSE fMRI, respectively. The area under the ROC curve for EEG is denoted as AUC EEG. For mean squared error scores lower values are better while a value of 1.0 indicates the best performance in terms of AUC EEG. The error bars indicate the 95% confidence intervals.

