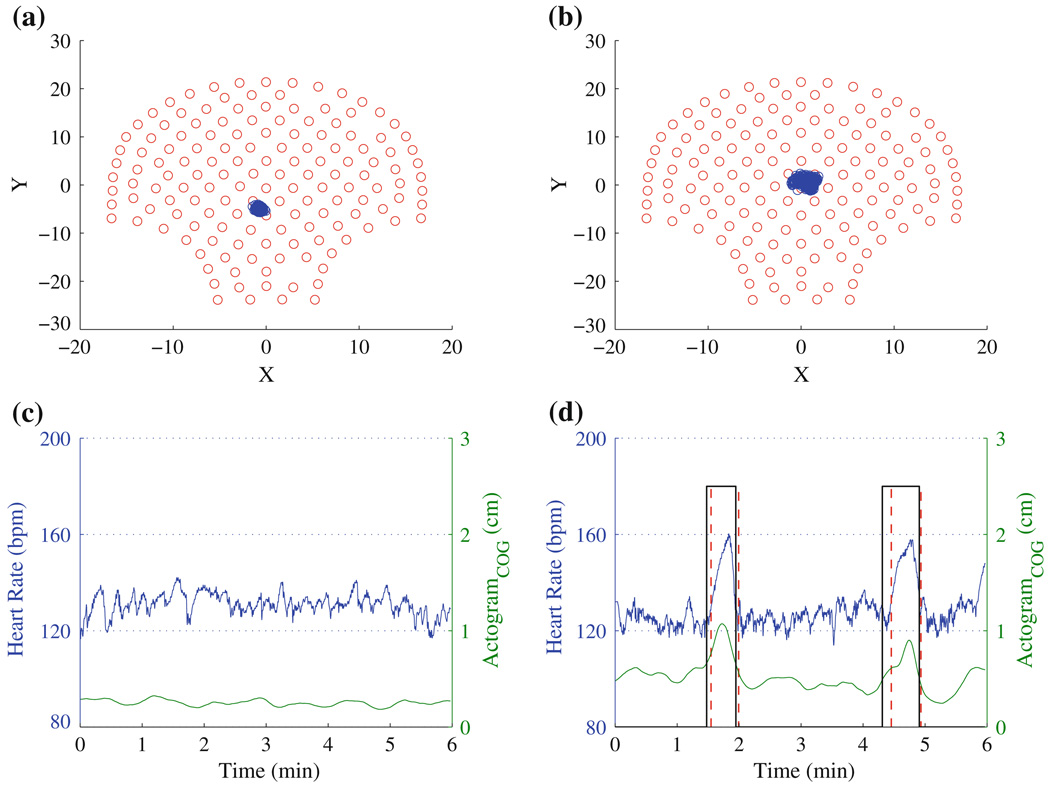
FIGURE 2.
The distribution of cog (on the 151-sensor array) obtained from two different fetuses: (a) while at rest and (b) during movement. The corresponding actocardiograms are shown in (c) and (d), respectively. The vertical solid and dashed lines represent significant acceleration detected in fHR and the significant movement detected using the proposed approach, respectively.

