
Figure 3.
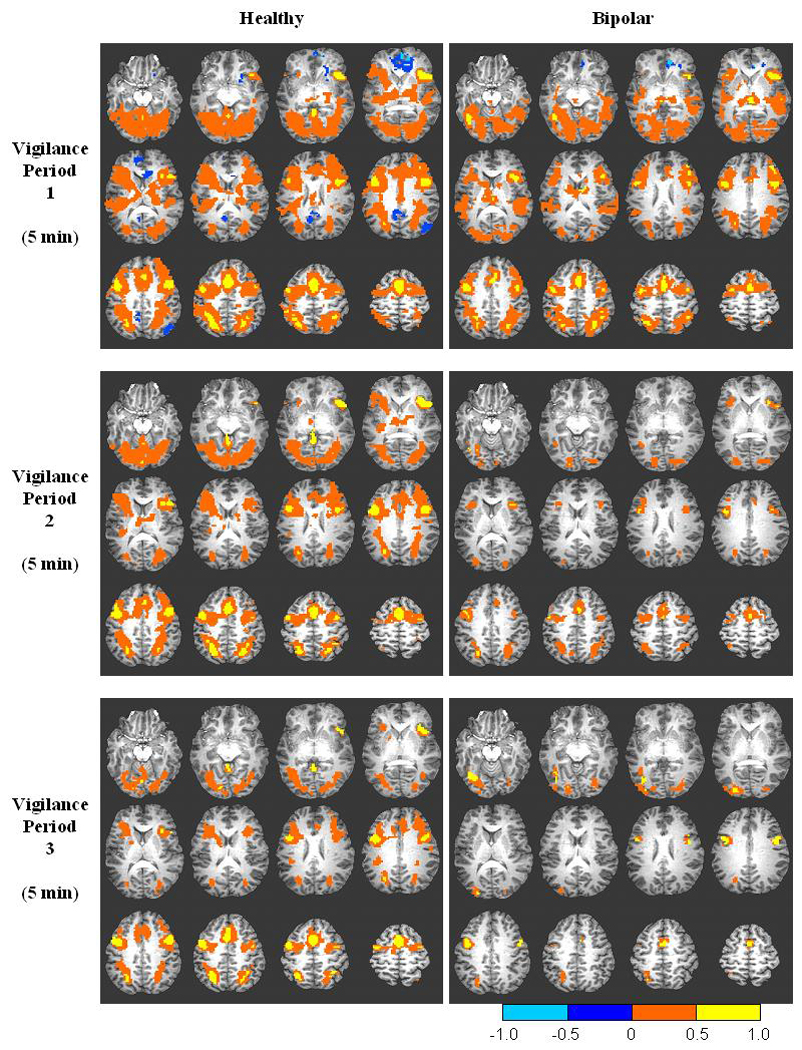
Composite functional brain maps of CPT-IP activation for correctly rejected trials in each successive vigilance period overlaid on T1-weighted anatomic image for the healthy and bipolar groups. Significant activation is defined as threshold p < 0.01 with voxel cluster size ≥ 100 to control for multiple comparisons (corrected p < 0.0001). Orange and blue scales represent activation and deactivation, respectively, relative to a zero activation baseline.