
Figure 5.
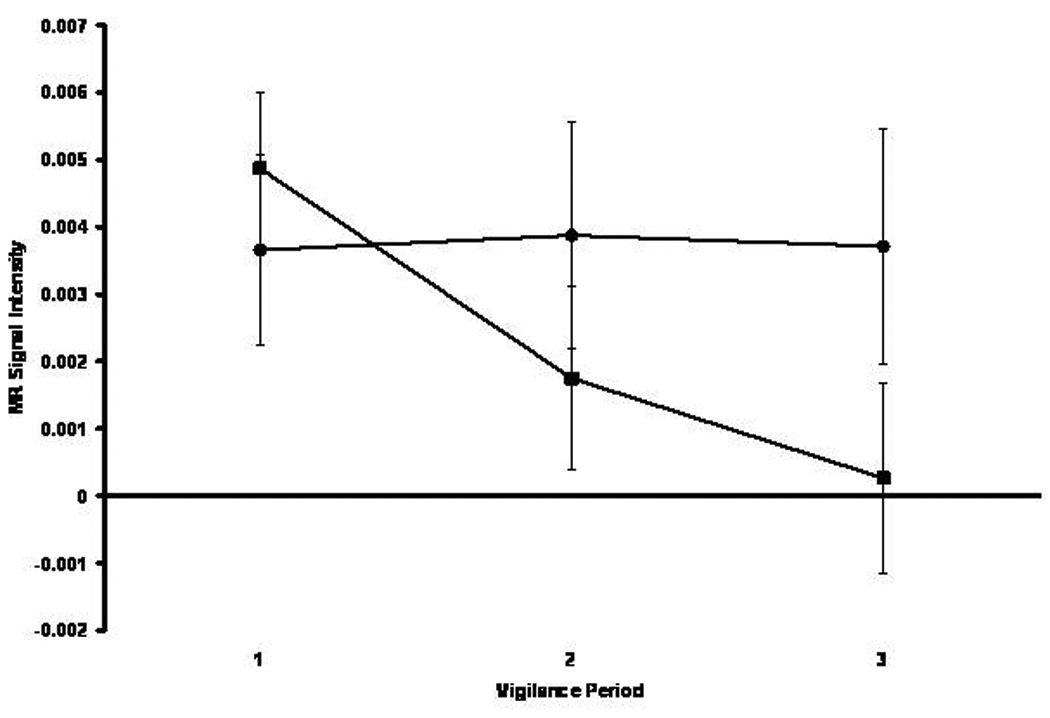
Mean MR signal intensity in left thalamus for the healthy comparison (black circle) and bipolar (black square) groups across three successive 5-min vigilance periods corresponding to performance early, intermediate, and late in the 15-min vigil.