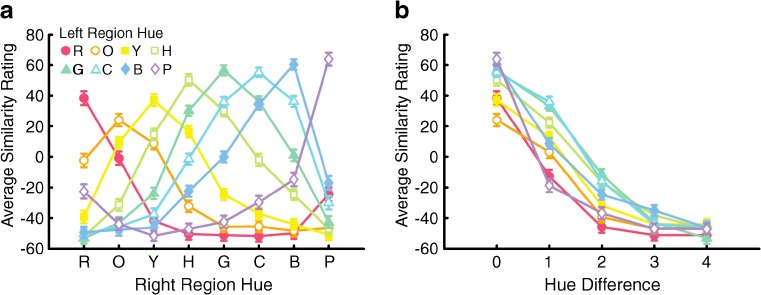
Fig. 10.
Similarity ratings for color pairs as a function of the hue on the right of the monitor (x-axis) and hue on the left of the monitor (separate lines) (a) and as a function of the hue difference (in terms of steps in the present BCP design) between the right and left colors (b). Error bars standard errors of the means (SEM)

