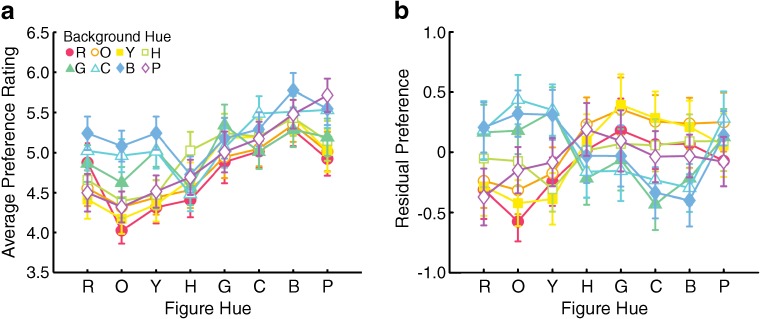
Fig. 12.
Preference ratings for each figural hue on each of the background hues as a function of figural hue (a) and residual figural color preference after accounting for figural preferences when rated on a neutral gray background (Palmer & Schloss, 2010) and pair preferences plotted as a function of figural hue (b). Error bars standard errors of the means (SEM)

