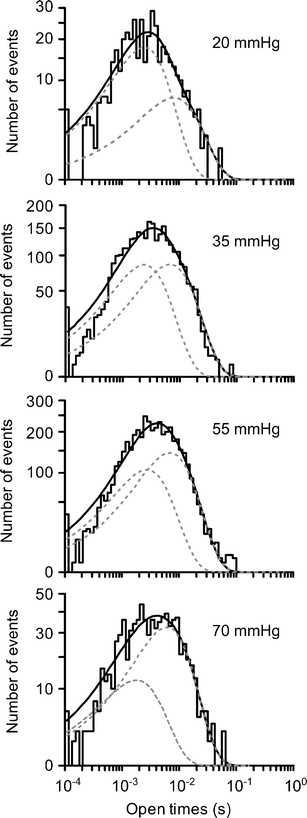
Fig. 2.

Channel open time distributions recorded at different levels of PCO2. Analysis of raw data from Fig. 1. The solid line is the combined fit of two exponential distributions, each shown separately as grey dashed lines. At each level of PCO2, the fitting of two exponential distributions gave a statistically significantly better fit than a single exponential (P < 0.02, F test). The effects of 55 and 70 mmHg on channel open times are probably underestimated as these were taken from stretches of data early in the application of the elevated PCO2 to minimize the occurrence of multiple-channel openings
