
Figure 7.
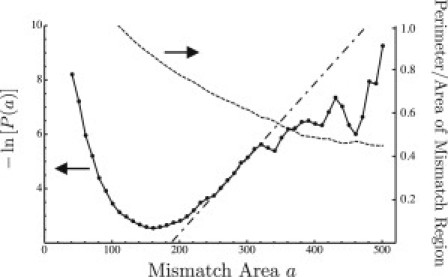
Solid line graphs , where is obtained from a histogram of the areas of mismatch regions (Fig. 6, light and dark gray) in lattice Monte Carlo simulations of two coupled mixtures undergoing phase separation. The dashed line is for each bin in the histograms of mismatch areas, the fraction of lattice sites, among those belonging to mismatch regions, which also lie on the boundaries of those regions. The dash-dotted line is a linear fit to based on mismatch areas that are insufficiently large, as shown by the fact that the perimeter/area ratio is still nonnegligible.