
Figure 4.
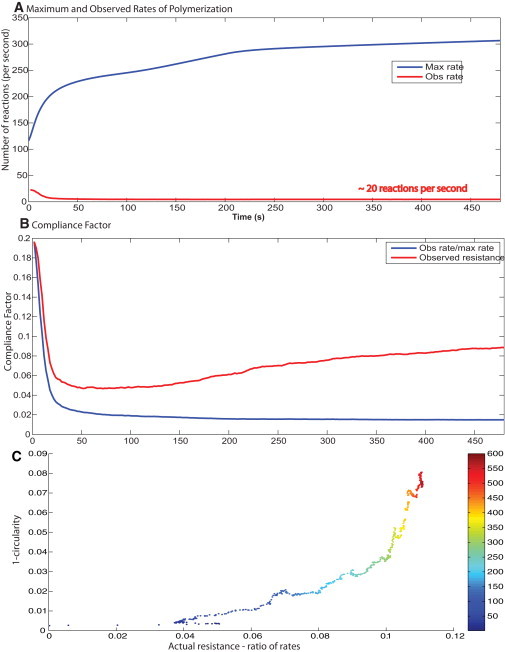
Rate of actin polymerization and membrane control of spreading dynamics. (A) The free rate of polymerization is obtained from the concentration profiles from the deterministic signaling model. The observed rate of polymerization is calculated from the spreading model. (B) The compliance factor from the simulations is compared with the ratio of Rfree/Robserved. At early times, there is a good match, but as the cell begins to deviate from a circular shape, the ratio of Rfree/Robserved and the actual compliance factor deviate from each other. (C) The changing shape over time (1-circularity) correlates well with the difference in the actual compliance factor calculated from the spreading model and the ratio of the observed to free polymerization rates. The color map on the plot shows the time point.