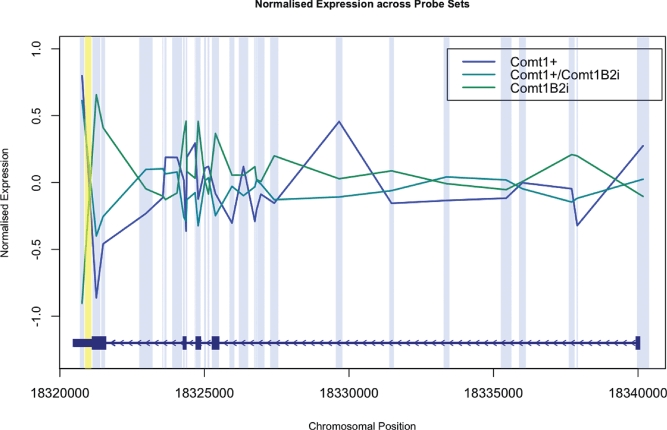
Figure 3.

Exon array Comt1 gene expression data. Genotype group means of standardized array signal intensities are plotted by genomic position. Comt1+/+ expression means are plotted in dark blue, Comt1+/B2i in teal and Comt1B2i/B2i in green. The structure of the gene is shown at the bottom, in genomic orientation (the 3′ end is at the left). Probe set positions are marked in light blue. The position of the B2 SINE insertion is shown in yellow. Probe sets flank, but do not span, the insertion site. Data presented are based on NCBI36/mm8.
