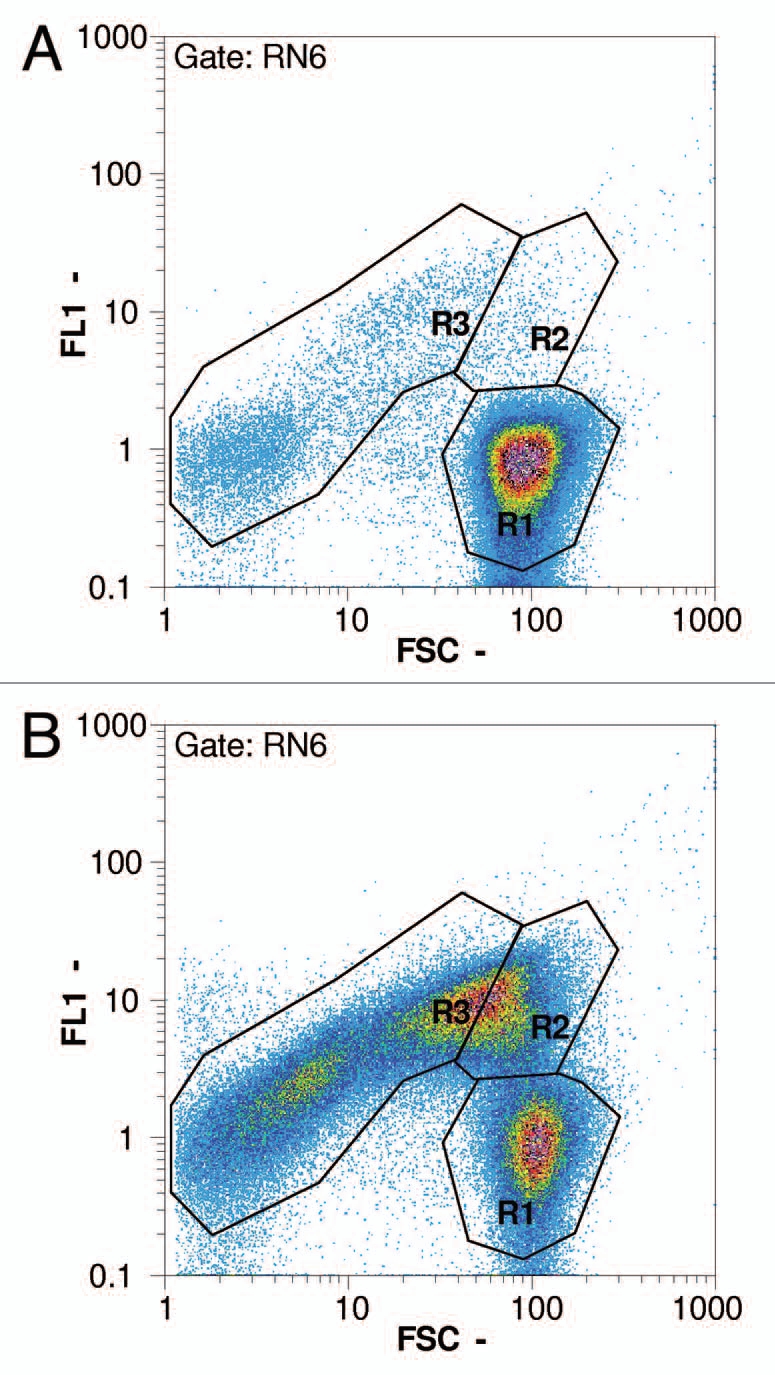
Figure 6.

Flow cytometry pictures following the progress of lysis in an E. coli NM522 culture (pGLysivb); R1: living cells, R2: dead but intact cells, R3: lysed cells (BG); RN6: exclusion of non-cellular background with RH414 (not shown); FSC - forward scatter, FL1 - fluorescence intensity by DiBAC4(3); (a) sample D (0 minutes, lysis induction), (b) sample E (30 minutes), (c) sample H (120 minutes, end of lysis phase).
