FIGURE 3.


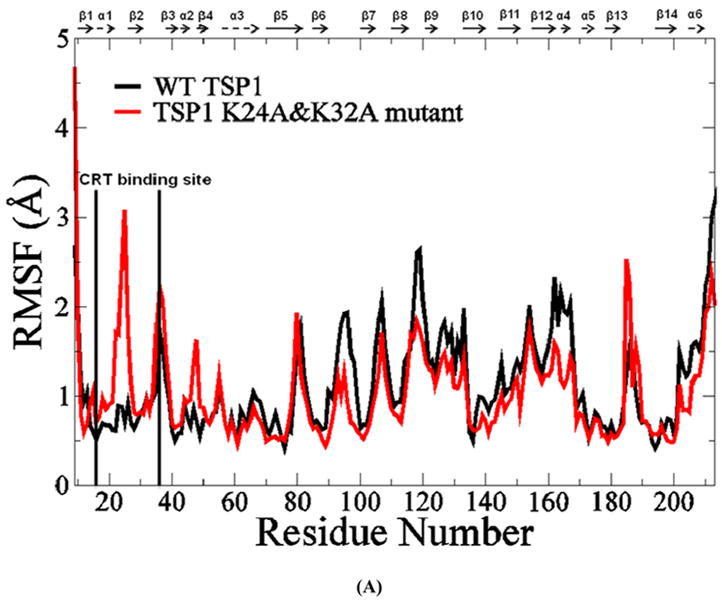
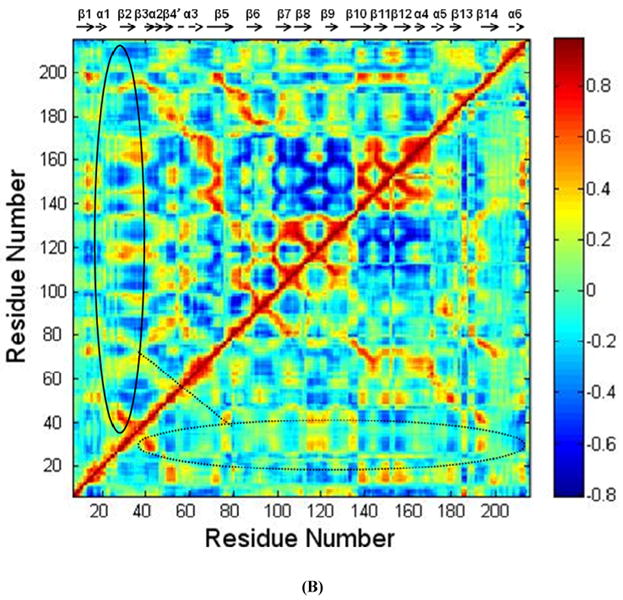
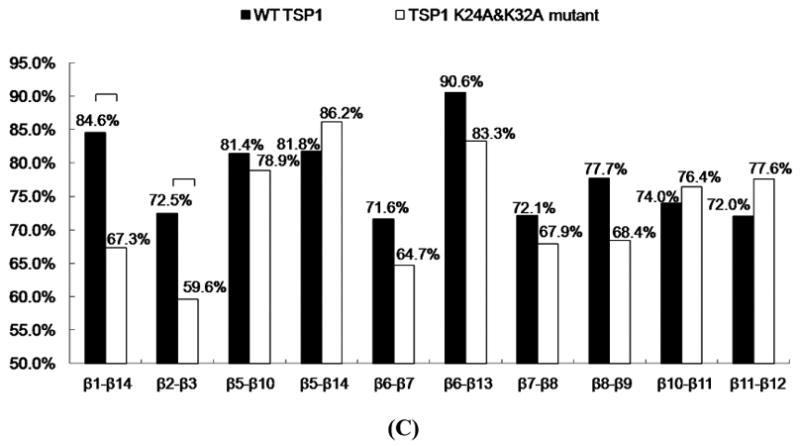
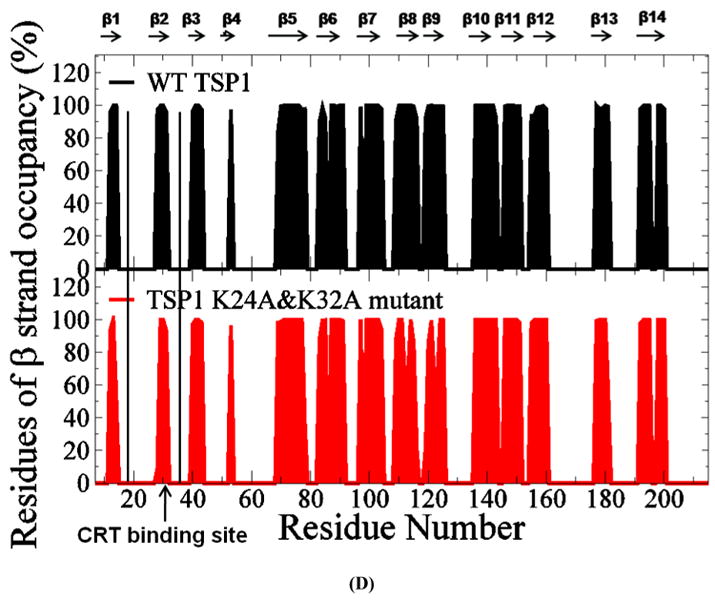
(A) Root mean squared fluctuation (RMSF) of TSP1 N-domain. β strands and α helices corresponding to the residues in TSP1 were marked on the top of RMSF figure. (B) Dynamical cross-correlation map for the degree of correlated motion of the residues in TSP1 (red: correlated motion between residues; blue: anti-correlated motion between residues; circled region showed the correlated motion between the residues in the binding site of TSP1 for CRT and the other residues of TSP1). Wild type TSP1 (top left) compared to TSP1 K24A & K32A mutant (right bottom). β strands and α helices corresponding to the residues in TSP1 were marked on the top of the dynamical cross-correlation map. (C) Hydrogen bond occupancy of each β strand pair in TSP1. (D) Residues of β strand occupancy in TSP1.
