
FIGURE 4.
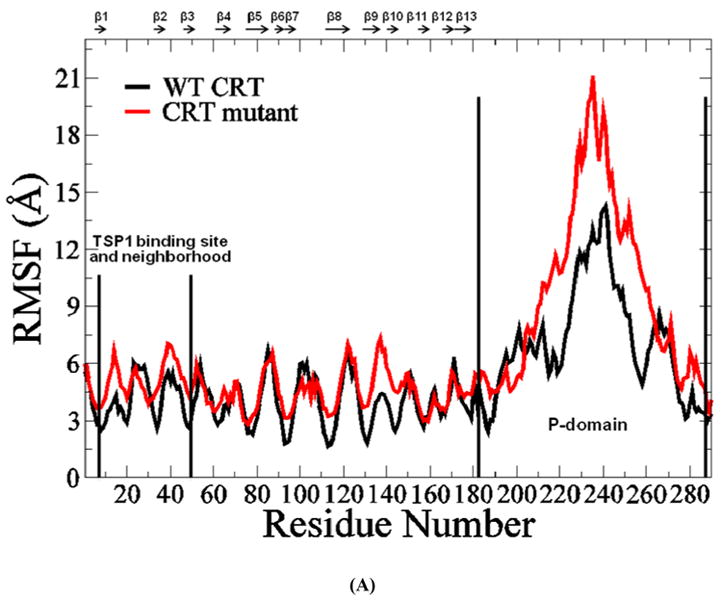
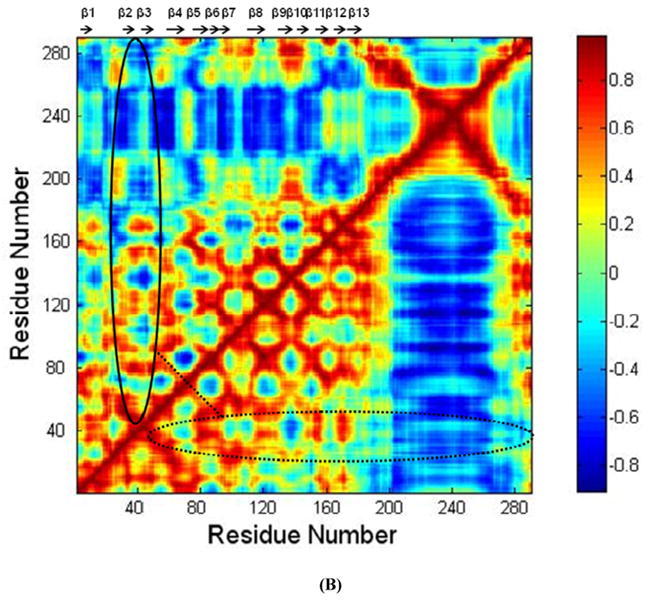
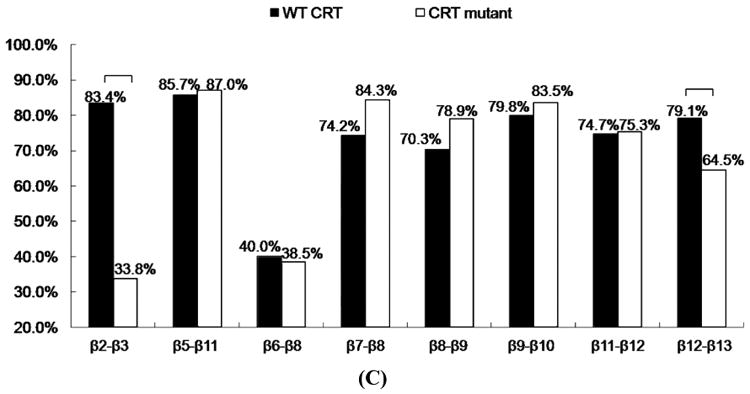
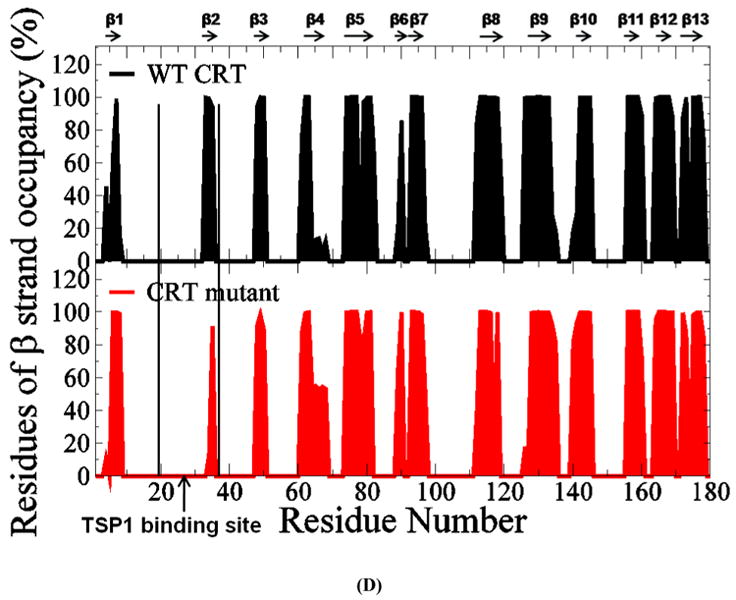
(A) RMSF of CRT. β strands corresponding to the residues in CRT were marked on the top of RMSF figure. (B) Dynamical cross-correlation map for the degree of correlated motion of the residues in CRT (red: correlated motion; blue: anti-correlated motion; circled region: correlated motion between the residues in the binding site of CRT for TSP1 and other residues of CRT). Wild type CRT (top left) compared to CRT mutant (res 24-26 & 32-34 mutated to Ala) (right bottom). β strands corresponding to the residues in CRT were marked on the top of the dynamical cross-correlation map. (C) Hydrogen bond occupancy of each β strand pair in CRT. (D) Residues of β strand occupancy in CRT.