
Figure 2.
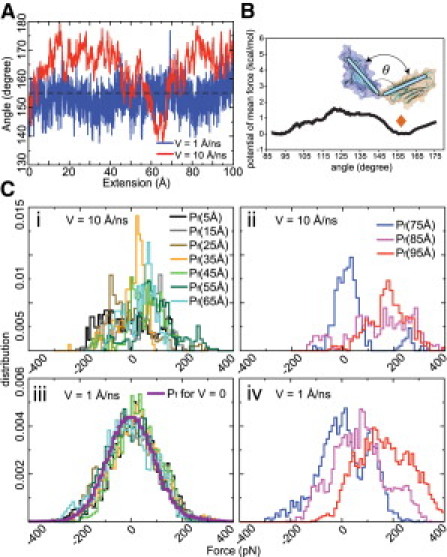
(A) Angle θ between Ig domains I68 and I69 as a function of the six-Ig chain extension measured in two SMD simulations (blue, v = 1 Å/ns; red, v = 10 Å/ns). A dashed line is drawn at θ = 155° as a guide to the eye. (B) PMF as a function of θ for I68-I69 (4); the orange diamond denotes the angle observed in an equilibrium simulation of I68-I69 (4). (C) Distribution of stretching forces: simulation with v = 10 Å/ns during (i) early stage of stretching and (ii) later stage of stretching, and simulation with v = 1 Å/ns during (iii) early stage of stretching and (iv) later stage of stretching.