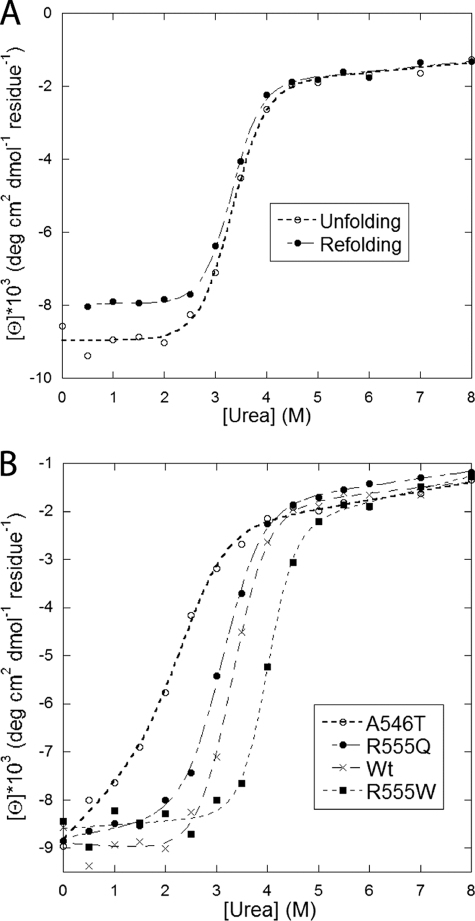
FIGURE 5.
Denaturation of FAS1-4 variants in urea monitored by the ellipticity at 222 nm. A, WT FAS1-4 unfolding and refolding data (i.e. the protein was transferred from respectively 0 and 8 m urea to different concentrations of urea). The superimposition of the two curves shows that unfolding is completely reversible. B, unfolding data for WT FAS1-4 and the three mutants A546T, R555Q, and R555W. Data were fitted to a two-state unfolding scheme as described (32), and midpoint denaturation concentrations are summarized in Table 3.

