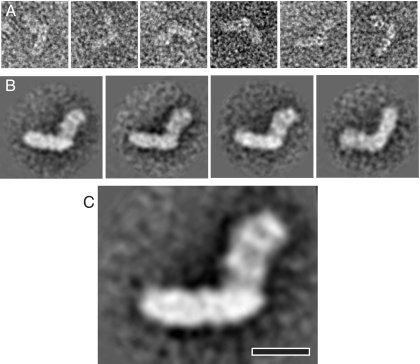
FIGURE 3.
Electron microscopy and single particle analysis. A, representative raw images of side views of negatively stained complex I from P. denitrificans. B, class sums of such images obtained after multiple reference analysis and classification into four classes. Three class sums on the left are of particles in the flip orientation, and the fourth is for flop orientation. C, best side view EM reconstruction (flip orientation after classification into two classes). The membrane arm of the complex is horizontal. Scale bar, 10 nm.

