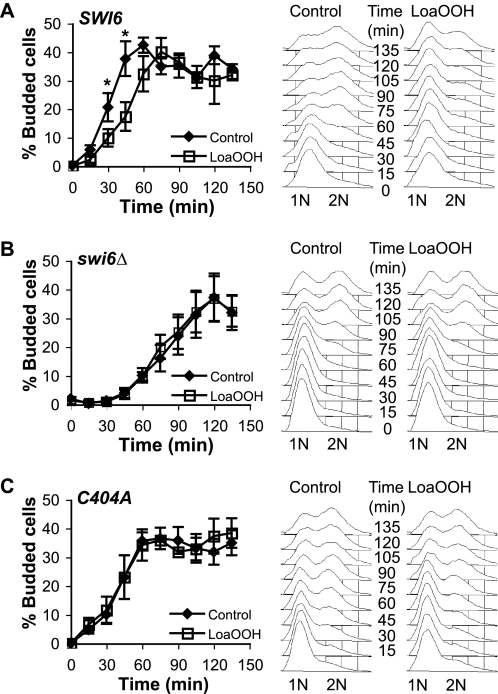
FIGURE 2.
Cell cycle delay phenotypes of the wild-type and swi6Δ and C404A mutant strains in response to LoaOOH. Cultures were synchronized with α-factor and were treated with LoaOOH for 45 min. Aliquots were sampled every 15 min post treatment, and the cells were fixed for bud counting or for FACS analysis of DNA content. For bud counts, 400–600 cells/sample were counted under a fluorescent microscope. A, SWI6 wild type; B, swi6Δ mutant; C, swi6Δ mutant with C404A construct. The data plotted are the averages of three independent experiments, and the error bars represent ± S.E. *, p value < 0.05, determined using the paired, two-tailed Student's t test. For FACS analysis, 25,000 cells were analyzed per sample. 1N represents a single copy of DNA per cell, and 2N represents two copies of DNA. A representative example of three independent experiments is shown.

