FIGURE 4.
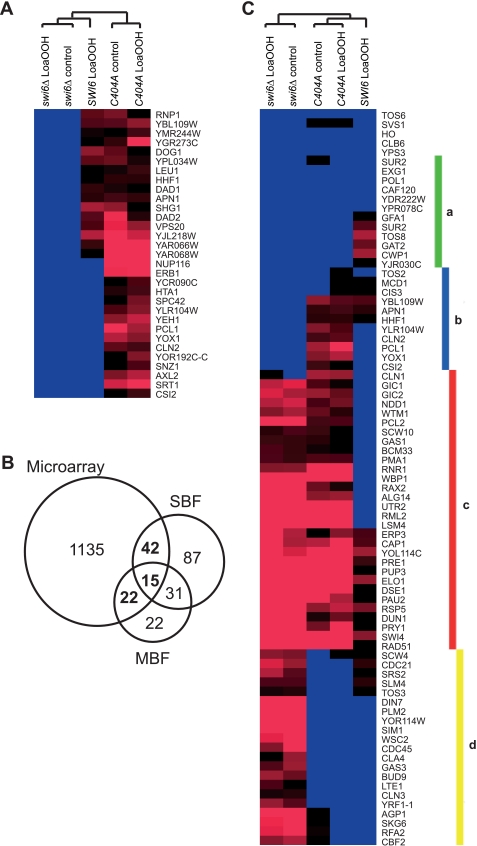
Microarray analysis of gene expression in the wild type and C404A and swi6Δ mutants subjected to LoaOOH treatment. The cultures of each strain were grown to A600 = 0.4 and treated with 30 μm LoaOOH for 45 min, and cell extracts were prepared for RNA extraction. Three biological replicates of each strain and treatment were performed. Gene expression from other genotypes and conditions was normalized as the intensity ratio relative to the untreated wild-type control. A, differentially expressed genes that were uniquely up-regulated in the C404A mutant with or without treatment from hierarchical clustering. B, genes identified in the microarray study that are known targets of SBF and/or MBF complexes (highlighted in bold). C, hierarchical clustering of the differentially expressed genes that are known targets of SBF, MBF, or both. The resulting clusters were enriched with genes in the functional grouping of cell wall components (cluster a), cell cycle (cluster b), cell shape (cluster c), and DNA replication (cluster d).

