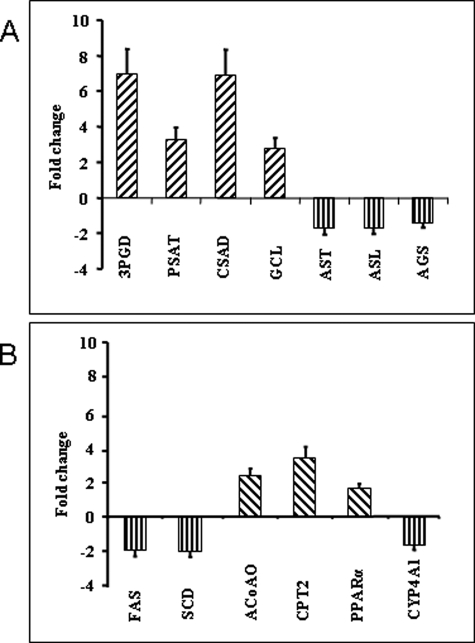
FIGURE 3.
Quantitative changes (mean ± S. E.) by real time PCR in the mRNA of the various genes in the liver of the protein-restricted animals. Bars above the base line show an increase and those extending below it show a decrease in the expression of mRNA. 3PGD, 3-phosphoglycerate dehydrogenase; PAST, phosphoserine aminotransferase; CSAD, cysteinesulfinic acid decarboxylase; CGL, glutamate-cysteine ligase; AST, argininosuccinate lyase; AGS, argininosuccinate synthase; FAS, fatty-acid synthase; SCD, steroyl-CoA desaturase; ACoAO, acyl-CoA oxidase; CPT2, carnitine-O-palmitoyltransferase.

