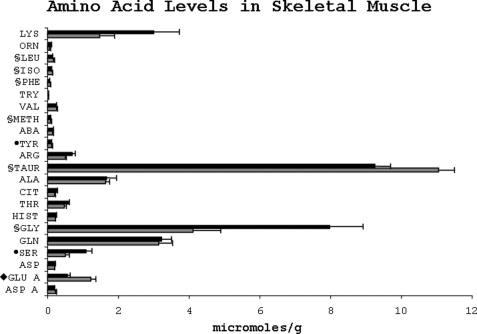
FIGURE 6.
Amino acid levels in skeletal muscle of rats fed either a low protein (dark bars) or a normal protein (light bars) diet. The amino acids are abbreviated as in Fig. 4. To maintain the scale of the graph, all values for amino acid are divided by 10. §, p < 0.05; ●, p < 0.025; ♦, p < 0.001.

