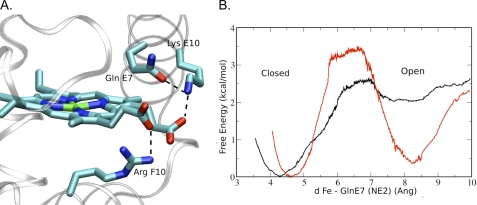
FIGURE 8.
MD simulations of the in to out Gln-44(E7) transition in wt CerHbO2. A, hydrogen-bonding interactions involving the simulated Gln-44(E7) out conformer and its neighboring residues are shown. B, free energy profile for the in to out Gln-44(E7) side-chain conformational transition. Results for the Fe2+ and Fe3+ cases are depicted using black and red lines, respectively. The reaction coordinate, d, in panel B is the iron to NE2 Gln(E7) distance in Ångstroms (Ang).

