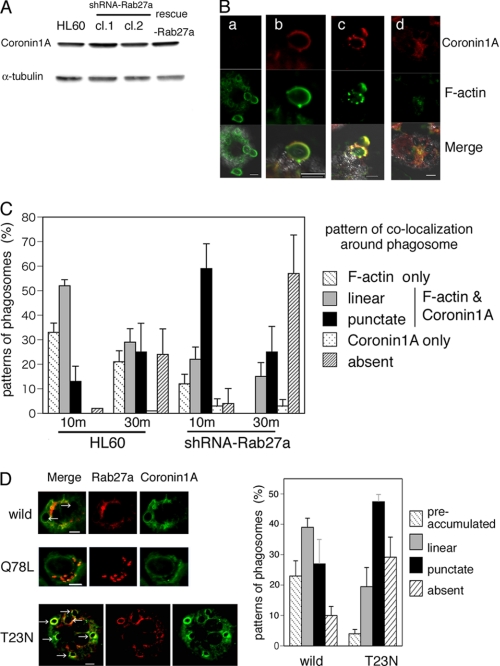
FIGURE 5.
Rab27a retains the actin-coating process by regulating Coronin 1A movement into phagosomes during complement-mediated phagocytosis. A, expression of Coronin 1A in HL-60 cells, Rab27a shRNA/HL cells (clones 1 (cl.1) and 2 (cl.2)), and FLAG-rescue-Rab27a/Rab27a shRNA cells by immunoblot analysis with antibodies against human Coronin 1A and α-tubulin as a loading control. B, distribution of Coronin 1A together with F-actin remodeling in the process of complement-mediated phagocytosis. Ten min after washing, zymosan particles were surrounded only by F-actin (panel a), and zymosan particles were surrounded in the linear form by both Coronin 1A and F-actin (panel b). Thirty min after washing, a dotted pattern of colocalization of Coronin 1A and F-actin around particles was seen (panel c). Phagosomes were formed inside the cells, and zymosan particles were not surrounded with Coronin 1A or F-actin (panel d). Scale bars = 5 μm. C, patterns of colocalization of Coronin 1A and F-actin around zymosan particles in the process of complement-mediated phagocytosis were counted in HL-60 and Rab27a shRNA/HL cells (clone 1). Patterns of colocalization of Coronin 1A and F-actin around zymosan particles were classified into five stages as indicated. More than 100 zymosan particles were classified into five stages, and the proportion of the stages was changed with the indicated time course up to 30 min. The data are means ± S.D. from three independent experiments. D, costaining of Coronin 1A (green fluorescence) and transiently expressed FLAG-tagged Rab27a visualized by Cy3-conjugated anti-FLAG antibody (red fluorescence) shown as wild-type Rab27a, Rab27a-Q78L (GTP-bound form), or Rab27a-T23N (GDP-bound form) in Rab27a shRNA/HL cells (clone 1) after phagocytosis assay for 30 min (left). Scale bars = 10 μm. The histograms indicate that the accumulation of Coronin 1A around phagosomes is promoted in Rab27a-T23N-expressing cells (right). Patterns of Coronin 1A accumulation around phagosomes were classified into four stages as indicated. More than 50 phagosomes were evaluated per assay. The data are means ± S.D. from three independent experiments.

