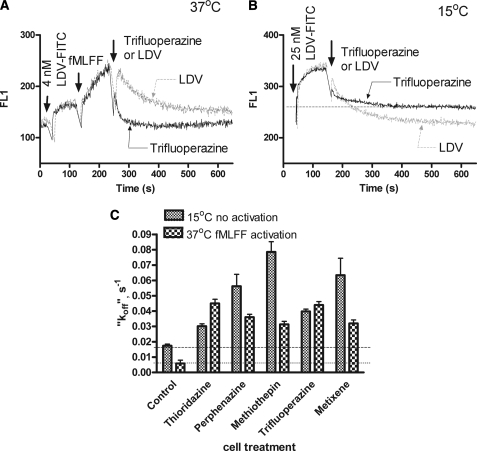
FIGURE 2.
Binding and dissociation of the LDV-FITC probe in response to the addition of screening hits. A, LDV-FITC probe binding and dissociation on U937 cells stably transfected with the non-desensitizing mutant of FPR plotted as mean channel fluorescence (FL1) versus time. The experiment involved sequential additions of the fluorescent LDV-FITC probe (4 nm), fMLFF (100 nm), LDV (control, excess unlabeled competitor), or saturating concentrations of compounds tested. One representative experiment (for trifluoperazine) out of two experiments for each compound is shown. B, LDV-FITC probe binding and dissociation on U937 cells plotted as mean channel fluorescence (FL1) versus time at low temperature (15 °C). The experiment involved sequential additions of the fluorescent LDV-FITC probe (25 nm), LDV (control, excess unlabeled competitor), or saturating concentration of compounds tested. One representative experiment (for trifluoperazine) of two experiments for each compound is shown. C, LDV-FITC “dissociation rates” (koff) obtained in kinetic experiments analogous to the experiments shown in panels A and B. The dissociation components of the curves were fitted to a single exponential equation using GraphPad Prism software and plotted for different compounds. Control represents the actual dissociation rates obtained using excess unlabeled competitor (LDV). Notice that for all treatment conditions koff values were larger than in the control sample, representing faster dissociation of the probe.

