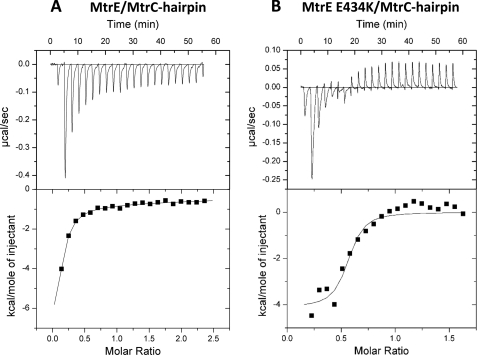
FIGURE 6.
ITC analysis of the interaction of the MtrC hairpin with MtrE and its E434K. 500 μm MtrC hairpin was titrated into (A) 15 μm MtrE and (B) 15 μm) MtrE E434K in a VP-ITC micro-calorimeter and the heat exchange determined at 25 °C. The upper panel shows the raw energy changes during the titration, while the lower panel represents the derived integrated total energy change as a function of the molar ratio (based on the molecular weight of the monomeric protein) of the interactant. In the case of wild-type MtrE, for which the titration was extended to a molar ratio of 2.5, the data were best-fitted to a two site model yielded the following thermodynamic parameters for the interaction: Ka1, Ka2, ΔH1, ΔH2, ΔS1, and ΔS2 of 4.6 (±0.61) × 105 m−1, 3.2 (±0.96) × 103 m−1, −1.2 (±1.31) × 104 cal·mol−1,−6.2 (±0.01) × 104 cal·mol−1, −11.4 cal·mol−1·K−1, and −190 cal·mol−1·K−1, respectively. In the case of the MtrE E434K derivative, the titration was restricted to a molar ratio of 1.5, and consequently it was only appropriate to fit the data to a one site model; the high-affinity site was characterized by a Ka, ΔH and ΔS of 8.2 (±4.8) × 106 m−1, −4115 (±311) cal·mol−1 and 17.8 cal·mol−1·K−1.

