FIGURE 2.
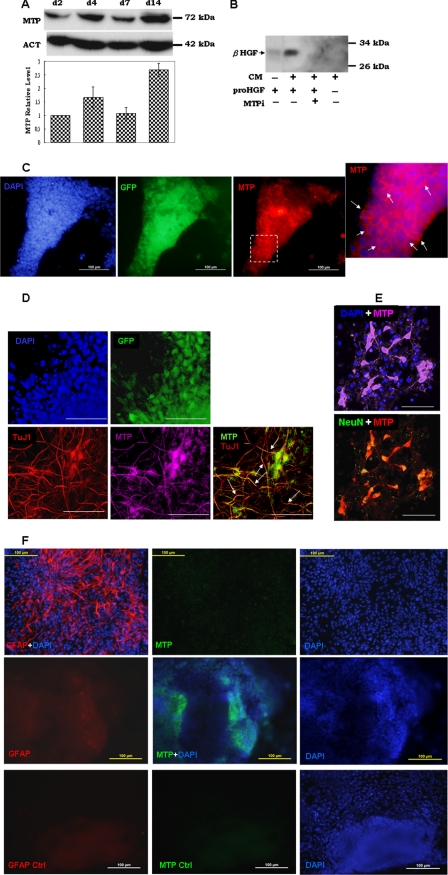
Expression of MTP during neural differentiation of mouse ES cells. A, 46C ES cells were seeded on a collagen-coated surface and cultured in neural differentiation culture conditions as described under “Experimental Procedures.” After 2 (d2), 4 (d4), and 7 days (d7) post-culture, cell extracts were prepared and subjected to Western immunoblot with anti-MTP (MTP) or anti-actin (ACT) antibody. The graph shows quantitation of chemiluminescence by densitometry. The value for each point was normalized to that for the day 2 point. Data were collected from two to three independent experiments. B, pro-HGF protein was incubated at room temperature with (+) or without (−) the various components as indicated. CM, conditional medium of Sox1-GFP+ NP cell culture; proHGF, single-chain latent form HGF preparation; MTPi, MTP-specific inhibitor. The lane marked “minus” in the CM row indicates unconditioned culture medium. Samples were boiled in SDS sample buffer and subjected to Western immunoblot with antibody to the β-chain HGF (β-HGF). C, day 4 cultures of NP cells were stained with antibodies to GFP (green) and MTP (red), and then detected with FITC- and TRITC-conjugated secondary antibodies, respectively. Arrows in the enlarged image of MTP staining shows the cell membrane location of this protein. Nuclei were counterstained with DAPI (blue). D, day 7 NP cells were triple stained with antibodies to GFP (green), MTP (purple), and βIII-tubulin (TuJ1) (red). Secondary antibodies used were FITC, Cy5, and TRITC-conjugated immunoglobin for GFP, MTP, and TuJ1, respectively. In MTP-TuJ-1 combined images, MTP is pseudo-colored in green for better viewing. White arrows indicate co-localization of TuJ1 and MTP on neurites. E, day 14 cells were stained with MTP and NeuN and visualized by Cy5 and TRITC-conjugated secondary antibodies, respectively. In the MTP-NeuN combined image, MTP staining was pseudo-colored in red for better viewing. Nuclei in all images were counterstained with DAPI (blue). Images in C are epifluorescence images. F, Sox1-GFP+ NP cells were induced to glial differentiation with ciliary neurotrophic factor for 10 days. Cells were stained with GFAP (red) and MTP (green). Images in the bottom column show background staining using the same subtype of immunoglobin as anti-GFAP (GFAP Ctrl) or anti-MTP (MTP Ctrl). Nuclei were counterstained with DAPI (blue). Images in D and E show three-dimensional Z-stack reconstructions scanned by confocal microscopy at 2-μm increments. The rest of the images were taken using epifluorescent microscopy. Bars: 100 μm in C and F, 50 μm in D and E.

