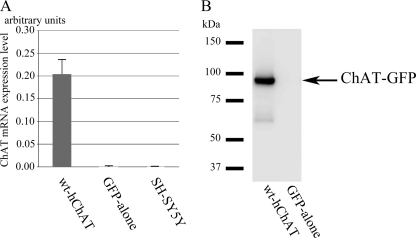
FIGURE 2.
The mRNA and protein expression of hChAT-GFP in a stable polyclonal cell line. A, the hChAT (CHAT) mRNA level in wt-hChAT-GFP cells. Total RNA was extracted from wt-hChAT-GFP (wt-hChAT), GFP alone, and native SH-SY5Y cells, and the relative levels of CHAT mRNA were evaluated using real time PCR assays. Native and GFP alone cells showed a trace level of CHAT mRNA expression that was less than 0.25% that of wt-hChAT-GFP cells. Values are the mean ± S.E. B, immunoblot of hChAT-GFP protein expression. Aliquots of cell homogenates containing the same amount of protein were subjected to immunoblotting. The blots were probed with an anti-ChAT antibody.

