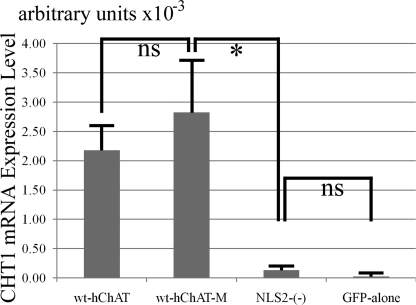
FIGURE 6.
Real time RT-PCR analysis of CHT1 mRNA expression in wt-hChAT-GFP-M and NLS2-(−)-hChAT-GFP cells. Total RNA was extracted from wt-hChAT-GFP (wt-hChAT), wt-hChAT-GFP-M (wt-hChAT-M), NLS2-(−)-hChAT-GFP ((NLS2-(−)), and GFP alone cells and was used as a template for a real time PCR assay. Values are the mean ± S.E. * indicates p < 0.05 significant difference by the non-parametric Mann-Whitney test, and ns represents not significant. Note that the catalytic activity of wt-hChAT-GFP-M cells was not significantly different from that of NLS2-(−)-hChAT-GFP cells.

