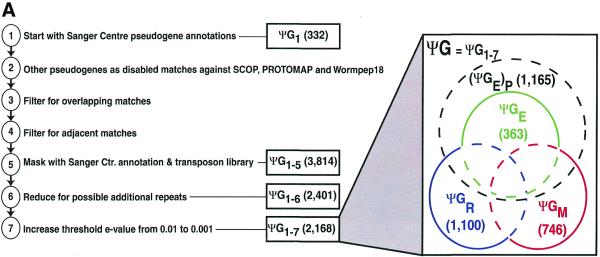
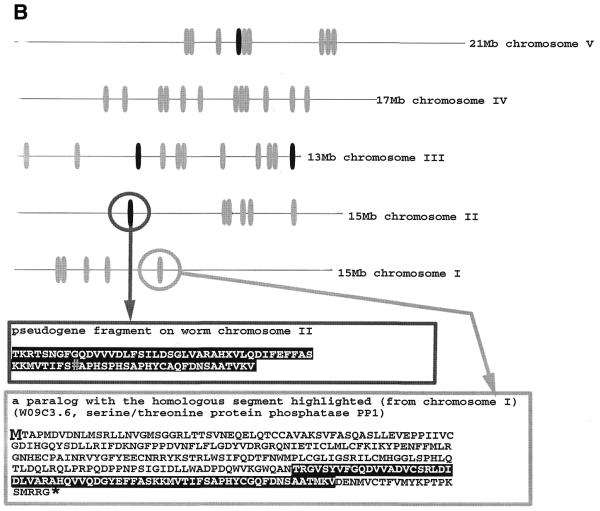
Figure 1.
(A) Schematic showing the derivation of the ΨG data set and its breakdown into subsets. The steps in the derivation of ΨG are summarized in Materials and Methods. The size of ΨG is indicated for the last two steps in this procedure. The name ΨG1–x indicates ΨG after x steps. The final ΨG data set comprises 2168 sequences. The subsets ΨGM, ΨGR, ΨGE and Ψ(GE)P that are mentioned in the text are indicated as a Venn diagram. (B) An example of a paralog family with associated pseudogenes. The positions of genes for the paralog family whose representative is the sequence C02F4.2, are indicated by grey ovals (totaling 40). The pseudogenes are marked with black ovals (totaling 4). A pseudogene fragment (ΨC02F4.2) from chromosome II is shown along with an example of a gene from this paralog family W09C3.6 (which is for a serine/threonine protein phosphatase PP1) with the homologous segment underlined. The pseudogene is interrupted by a frameshift relative to this gene (marked by #). The corresponding sequence in the gene paralog is boxed in black. This corresponds to one exon of the gene paralog. *, stop codon.


