Figure 3.

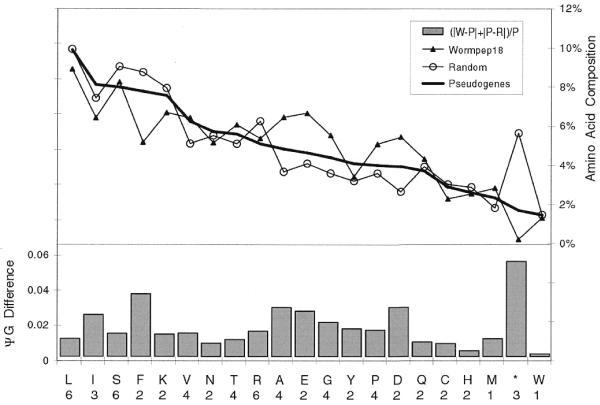
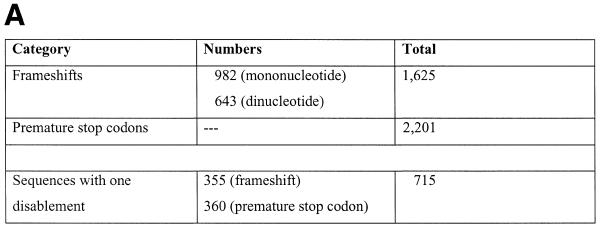
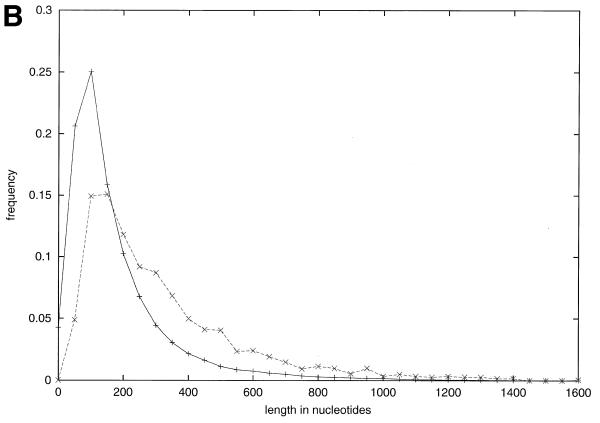
Disablements, length and composition for ΨG. (A) Simple disablements. This data is only for the ΨG population directly derived from Wormpep18. (B) Length distribution of pseudogene matches. The distribution of pseudogene match lengths (in nucleotides) is shown as a dotted line, and of lengths for worm gene exons by a solid line. The lengths of the Sanger Centre annotated genes are not included as these are more carefully parsed predictions arising from a gene prediction algorithm. Each point n, the count of exons or matches for an interval from n to 50n. Every fourth point is indicated on the x-axis. (C) Composition for ΨG. The amino acid composition of the Wormpep18 database is compared to the implied amino acid composition of random non-repetitive genomic sequence and the ΨG population. The percentage composition for each of the 20 amino acids is graphed in decreasing order of the implied amino acid composition in the pseudogene set. In the bottom part of the figure, the ΨG difference for each amino acid composition is indicated by a bar. This is defined as (|w–p| + |p–r|)/p, where w is the amino acid composition value for the Wormpep18 proteins, r is the implied composition for random genomic sequence and p is the implied pseudogene composition. *, termination codons. The number of codons for each amino acid type is written below the one-letter code for the residue.


