
Figure 1.
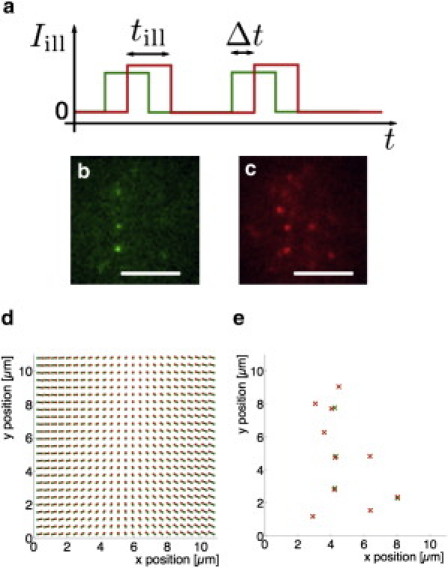
Illumination scheme and position determination. (a) Laser pulses of duration till are temporally offset by a time lag Δt. (b) Raw image from the Cy3B channel. (c) Raw image from the ATTO647N channel. Δt = 0 ms. Scale bar is 5 μm. (d) Correction for chromatic aberration. The scheme shows positions in the Cy3B (green dots) and ATTO647N (red dots) channel which correspond to the same physical positions. (e) Identified single-molecule signals from the images shown in panels b and c, corrected for chromatic aberration.