
Fig 6. RGC synaptic activity is normal in CD3ζ-/- mice in the first week after birth, but abnormal in the second week.
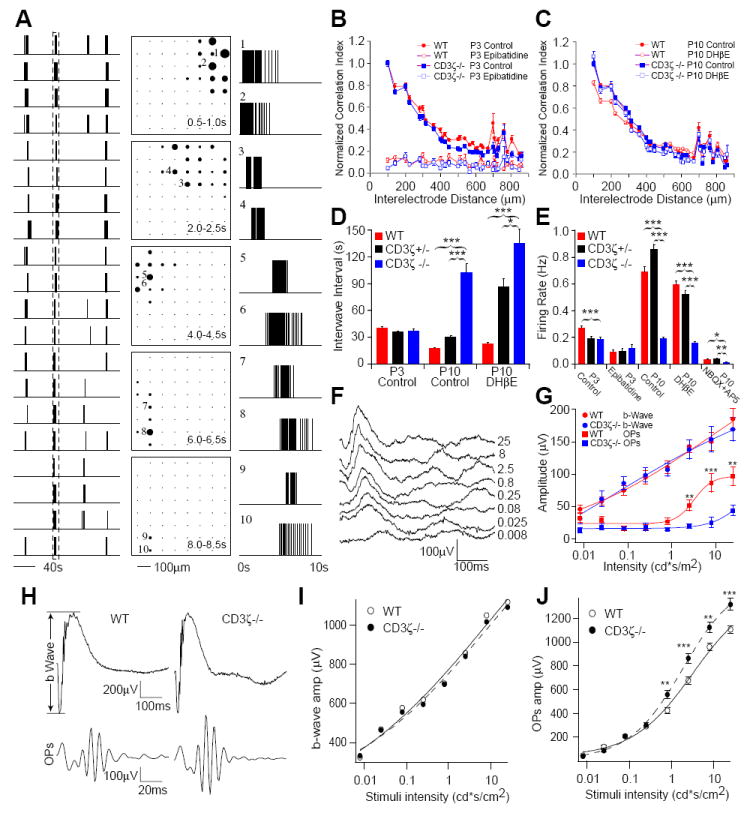
Spontaneous retinal waves, mediated by nAChRs during the first postnatal week and GluRs during the second postnatal week, were recorded from WT, CD3ζ+/- and CD3ζ-/- mice using a MEA system. Light evoked inner and outer retinal responses were measured using electroretinogram (ERG) recordings at P14 and P30 in WT and CD3ζ-/- mice. (A) Example of retinal waves recorded from a P10 WT retina. Left column: Spike trains from twenty neurons. Center column: Diagrams of the array show the propagation of a wave from the top right to the bottom left. Each frame shows the firing rate averaged over 0.5 sec. Each black circle represents one cell, with the radius of the circle proportional to its firing rate. Right column: Spike trains of ten neurons selected from the time window shown in the left column. The position of each neuron is represented with the number in the center column. (B) Normalized correlation index, taken from the MEA recordings in P3 WT, CD3ζ+/- and CD3ζ-/- mice. Retinal waves in WT, CD3ζ+/- and CD3ζ-/- mice are blocked by bath application of 10 nM Epibatidine, a nAChR agonist. (C) Normalized correlation index in P10 WT, CD3ζ+/- and CD3ζ-/- mice. Pharmacological manipulation of nAChRs had no effect on retinal waves in the second week. (D) Average interwave interval in WT, CD3ζ+/- and CD3ζ-/- mice at P3 and P10, showing that waves are much less frequent in CD3ζ-/- in the second week. (E) Average firing rate of WT, CD3ζ+/- and CD3ζ-/- mice at P3 and P10. (F) Representative ERGs recorded from a P14 WT mouse evoked by eight different light intensities. (G) The average amplitudes of ERG b-waves and OPs of CD3ζ-/- and WT mice recorded at P14. (H) Representative ERG and OP waveforms from P30 WT and CD3ζ-/- mice. (I) Average amplitude of ERG b-waves. (J) Average amplitude of ERG OPs are significantly bigger in CD3ζ-/- mice.