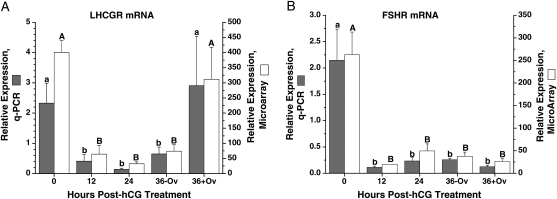
Figure 2.
The relative expression of LH/choriogonadotrophin receptor (LHCGR) (A) and FSHR (B) mRNAs in the periovulatory follicle of the rhesus monkey. X-axis is the timepoint of follicle collection at 0 h (before hCG treatment), 12, 24 and 36 h (36−Ov, unruptured follicle; 36 + Ov, ruptured follicle) post-hCG treatment in a COv protocol (Young et al., 2003). Gray bars are the q-PCR quantification of mRNA levels normalized to 18S RNA. Open bars are the microarray evaluation of the relative gene expression. Different letters above the bars indicate a significant difference (P< 0.05) between the timepoints within one analysis (lower case, RT–PCR; upper case, microarray).

