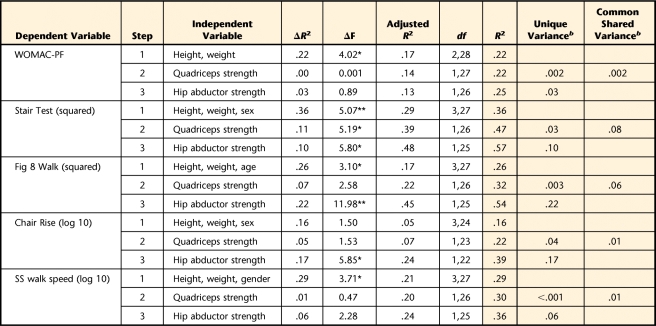
Table 3.
Hierarchical Regression Analysis for Muscle Strength Predicting Physical Functiona
WOMAC-PF=Western Ontario McMaster University Osteoarthritis Index physical function subscale, Stair Test=Stair Ascend/Descend Test, Fig 8 Walk=Figure-of-8 Walk Test, Chair Rise=5-Chair Rise Test, SS=self-selected. * P<.05, ** P<.01. The shaded area indicates the unique and common components of shared variance of quadriceps and hip abductor muscle strength on physical function.
b Equivalent to R2.

