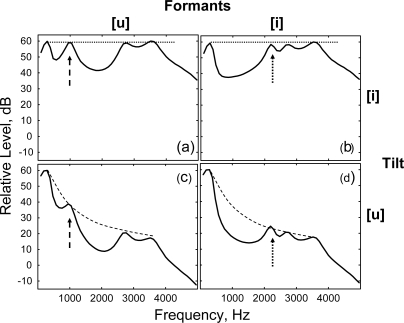
Figure 1.
Corner stimuli of the target vowel matrix used for all experiments. Stimuli in the left column have the most [u]-like F2 frequency (1000 Hz, dashed arrow) and stimuli in the right column have the most [i]-like F2 frequency (2200 Hz, dotted arrow). Stimuli in the upper row have the most [i]-like tilt spectral tilt (0 dB∕oct, dotted line) and stimuli in the bottom row have the most [u]-like spectral tilt (−12 dB∕oct, dashed line).

