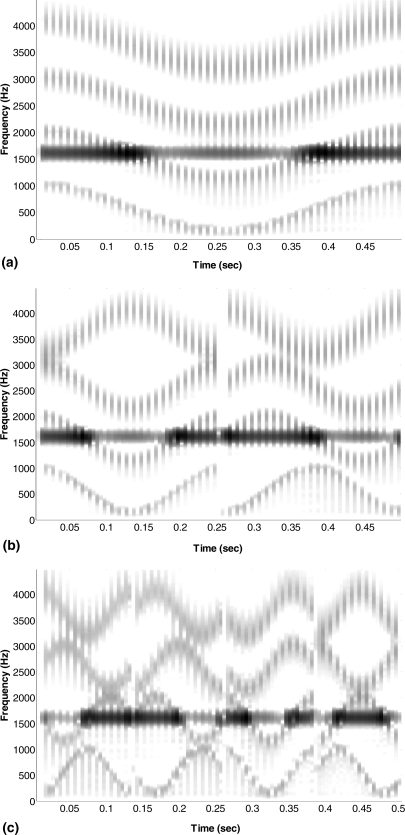
Figure 10.
Spectrograms of sample precursors with 2-, 4-, or 8-Hz modulation rates (top, middle, and bottom panels, respectively) for experiment 2A that were filtered to have a spectral peak that matched the F2 frequency (1600 Hz) of the following vowel. Increases in modulation rate increases the number of times the full spectrum is sampled.

