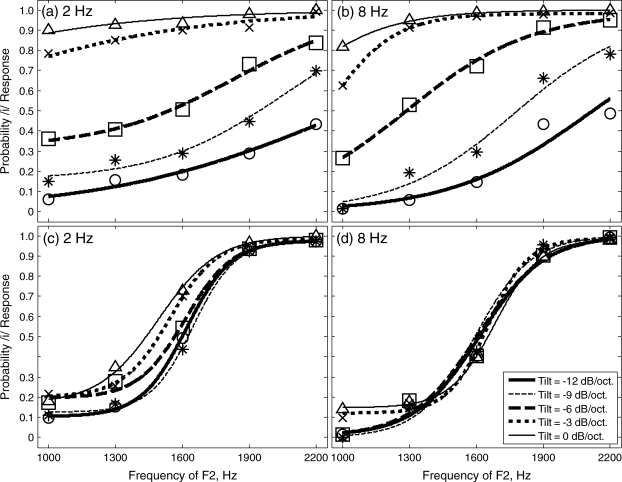
Figure 11.
Mean identification rates for 2- and 8-Hz modulation rates of F2-matched precursors in experiment 2A are plotted in panels (a) and (b), respectively. 2- and 8-Hz modulation rates of tilt-matched precursors in experiment 2B are plotted in panels (c) and (d), respectively. See Fig. 4a caption for details.

