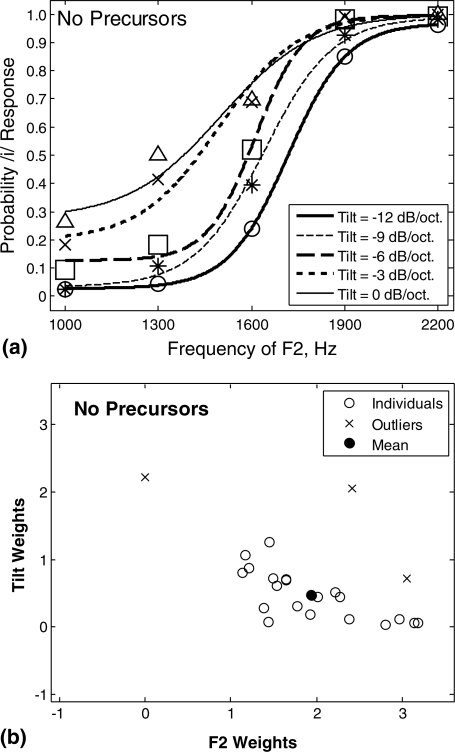
Figure 4.
(a) Mean identification rates for vowels in isolation (i.e., no precursors) with probability of responding ∕i∕ as a function of F2 frequency plotted separately for each vowel tilt. Circles, asterisks, squares, x’s, and triangles represent mean data for vowel tilts of −12, −9, −6, −3, and 0 dB∕oct, respectively. Maximum likelihood fits of identification rates are displayed for mean data at each vowel tilt as different lines (see legend). (b) Scatter plot of F2 (abscissa) and tilt (ordinate) weights (standardized regression coefficients) for each listener in the control condition plotted as open circles. x’s indicate excluded multivariate outliers and the filled circle is the mean of the remaining data.

