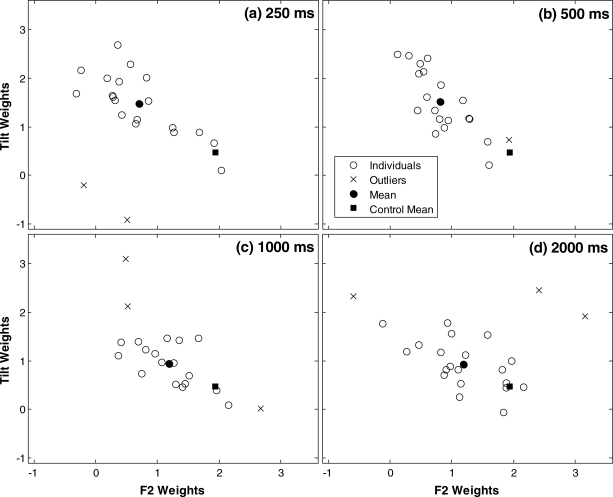
Figure 6.
Scatter plots of individual F2 and tilt weights (open circles) for each duration of F2-matched precursors in experiment 1A. x’s indicate excluded multivariate outliers, the filled circle is the mean of the remaining data, and the filled square is the mean of the control condition from Fig. 4b.

