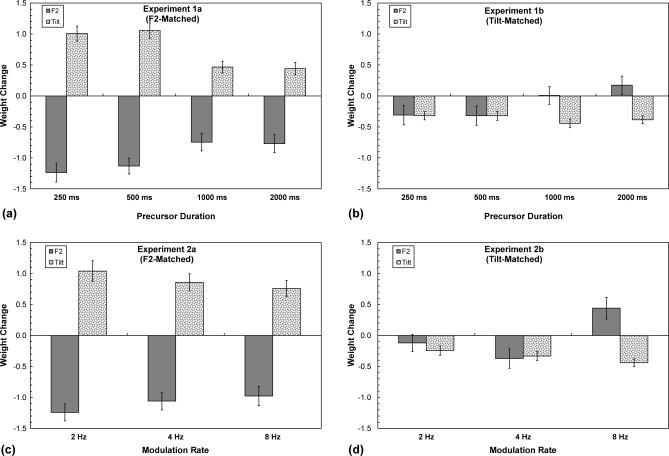
Figure 7.
For experiments 1 and 2 (top and bottom panels, respectively), the change in F2 weights (solid bars) and tilt weights (speckled bars) attributed to F2-matched precursors (left panels) and tilt-matched precursors (right panels) are plotted as a function of precursor duration. Error bars represent standard error.

