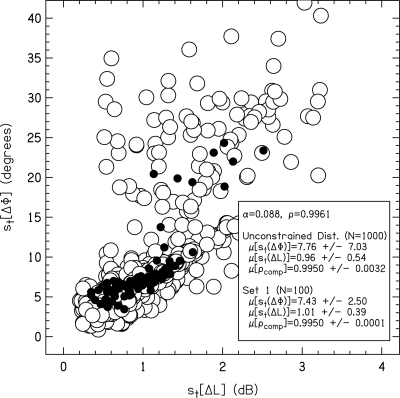
Figure 2.
Fluctuations of IPD [st(ΔΦ)] vs fluctuations of ILD [st(ΔL)] for N=1000 randomly generated stimuli with α=0.088 (open circles). The mean of the distributions (μ) and the standard deviation is reported for st(ΔΦ), st(ΔL), and ρcomp. An example experimental set of 100 stimuli, set 1 for listener S3, is also shown (closed circles). Note that some of the 1000 open circles are located outside the plotted area.

