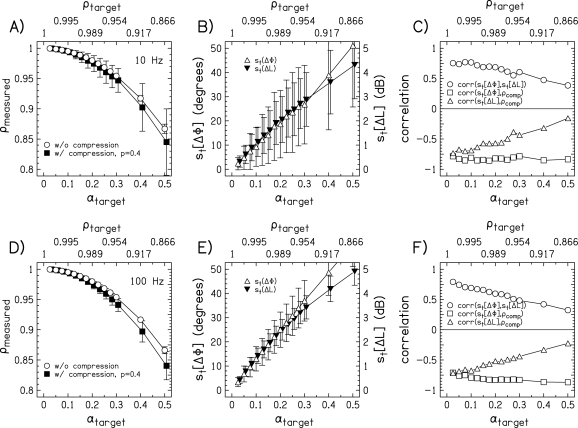
Figure 3.
Distribution statistics for sets of 1000 stimuli at different target values of α. The top axis shows the targeted value of interaural correlation, ρ, for the corresponding value of α. The top row shows data for 10-Hz bandwidth stimuli. The bottom row shows data for 100-Hz bandwidth stimuli. Panels (A) and (D) show the average measured value of ρ for different values of α, without and with envelope compression as open circles and closed squares, respectively. Panels (B) and (E) show the average measured interaural phase fluctuations, st(ΔΦ), as open triangles and interaural level fluctuations, st(ΔL), as closed triangles. Error bars in panels (A)–(D) represent ±1 standard deviation of the mean. Panels (C) and (F) show the correlation between the stimulus metrics st(ΔΦ), st(ΔL), and ρcomp.

