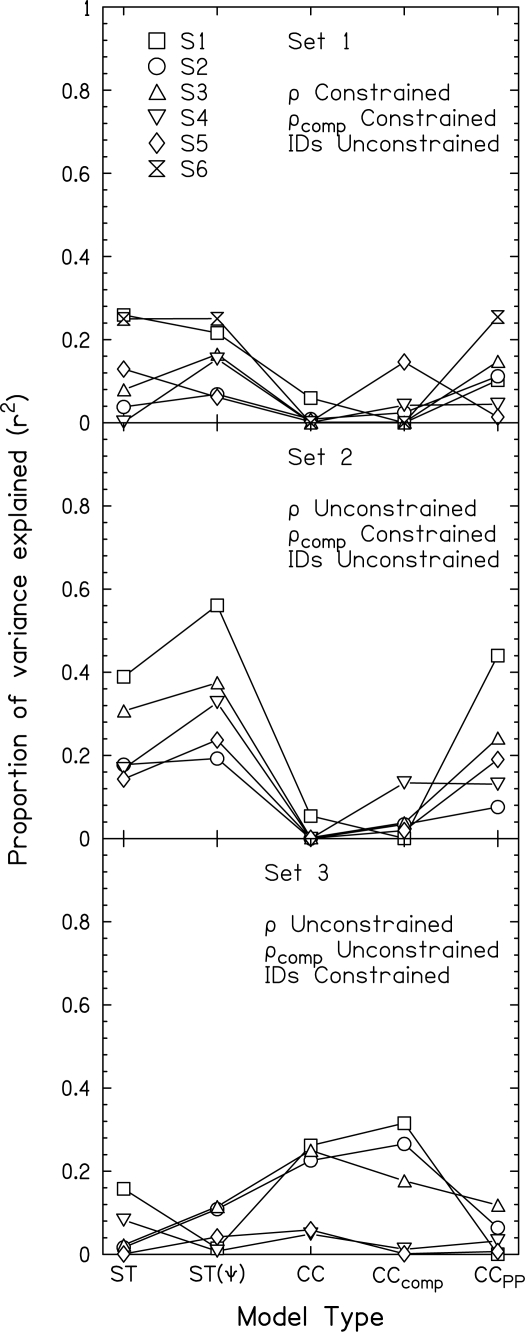
Figure 6.
The proportion of variance in the detection data explained by each model. The models are the sum of interaural differences (ST), the sum of interaural differences after psychological transformations [ST(Ψ)], the normalized CC, the normalized CC with envelope compression (CCcomp), and the normalized CC model including several other stages of peripheral processing (CCPP).

