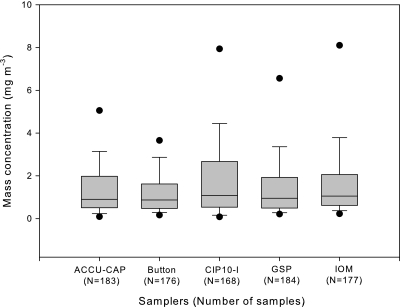
Fig. 3.
The box plot of wood dust mass concentration (milligrams per cubic meter) by different samplers without outliers. The horizontal lines in the box plot from bottom to top indicate 10th, 25th, 50th (median), 75th, and 90th percentiles. The circles indicate the 5th (lower circle) and 95th (upper circle) percentiles. N is the number of samples for each sampler, and the total sample number is 888 when all samplers combined.

