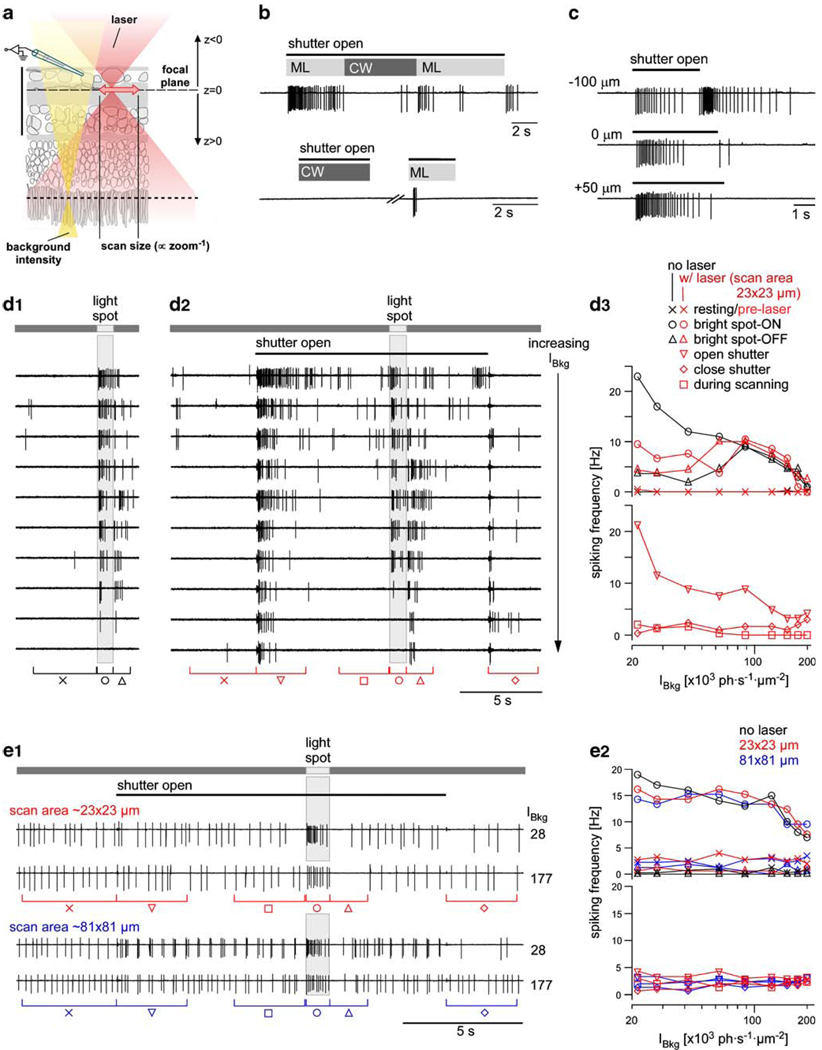
Fig. 7. Laser-evoked responses in the absence of fluorescent dye.
a Schematic cross-section of the retina illustrating scan size and focal planes (both for 2P imaging and light stimulation) relative to the recorded ganglion cell. b Spiking responses of two unidentified ganglion cells (extracellular recordings) to opening/closing of the laser shutter and to switching the laser between mode lock (ML) and continuous wave (CW) (scan area: 141×141 µm, 128×128 pixels/frame, at 2 ms/line; stimulator background intensity IBkg=21×103 photons·s−1·µm−2). c Spiking response of an ON ganglion cell (extracellular recording) to the laser (in ML mode) when varying the z position of the focal plane (as illustrated in a) (scan area and resolution as in b; IBkg=84×103 photons·s−1·µm−2) d Spiking response of an ON/OFF ganglion cell to a bright spot stimulus (200 µm in diameter) for increasing IBkg before (d1) and during (d2) laser scanning. Bars above traces indicate when spot was presented and when laser shutter was opened/closed. Spiking frequency as function of IBkg (d3) for different time windows as indicated by the brackets below the traces (contrast (Ispot –Ibkg)/(Ispot + Ibkg) between stimulus spot and background: 32%, 39%, 36%, 33%, 27%, 16%, 13%, 10%, and 4%. Scan area: 23×23 µm, 256×256 pixels at 2 ms/line) e Spiking response of an ON ganglion cell; same conditions as in d except that the spot diameter was 800 µm and the scan area (zoom) was varied. Only traces for two different IBkg are shown. Laser: tuned to ~925 nm; mode locked (ML) except in b; power: b, c, e ~12 mW; d ~7 mW; focal plane in the GCL except in c. Stimulator LED: yellow, band pass-filtered (578 BP 10) and used for both stimulus and background

